qiskit.visualization.plot_error_map
qiskit.visualization.plot_error_map(backend, figsize=(15, 12), show_title=True, qubit_coordinates=None)
Plots the error map of a given backend.
Deprecated since version 1.4
Parameters
- backend (Backend) – Given backend.
- figsize (tuple) – Figure size in inches.
- show_title (bool) – Show the title or not.
- qubit_coordinates (Sequence) – An optional sequence input (list or array being the most common) of 2d coordinates for each qubit. The length of the sequence much mast the number of qubits on the backend. The sequence should be the planar coordinates in a 0-based square grid where each qubit is located.
Returns
A matplotlib figure showing error map.
Return type
Figure
Raises
- VisualizationError – The backend does not provide gate errors for the ‘sx’ gate.
- MissingOptionalLibraryError – If matplotlib or seaborn is not installed.
Example
from qiskit.visualization import plot_error_map
from qiskit.providers.fake_provider import GenericBackendV2

backend = GenericBackendV2(num_qubits=5)
plot_error_map(backend)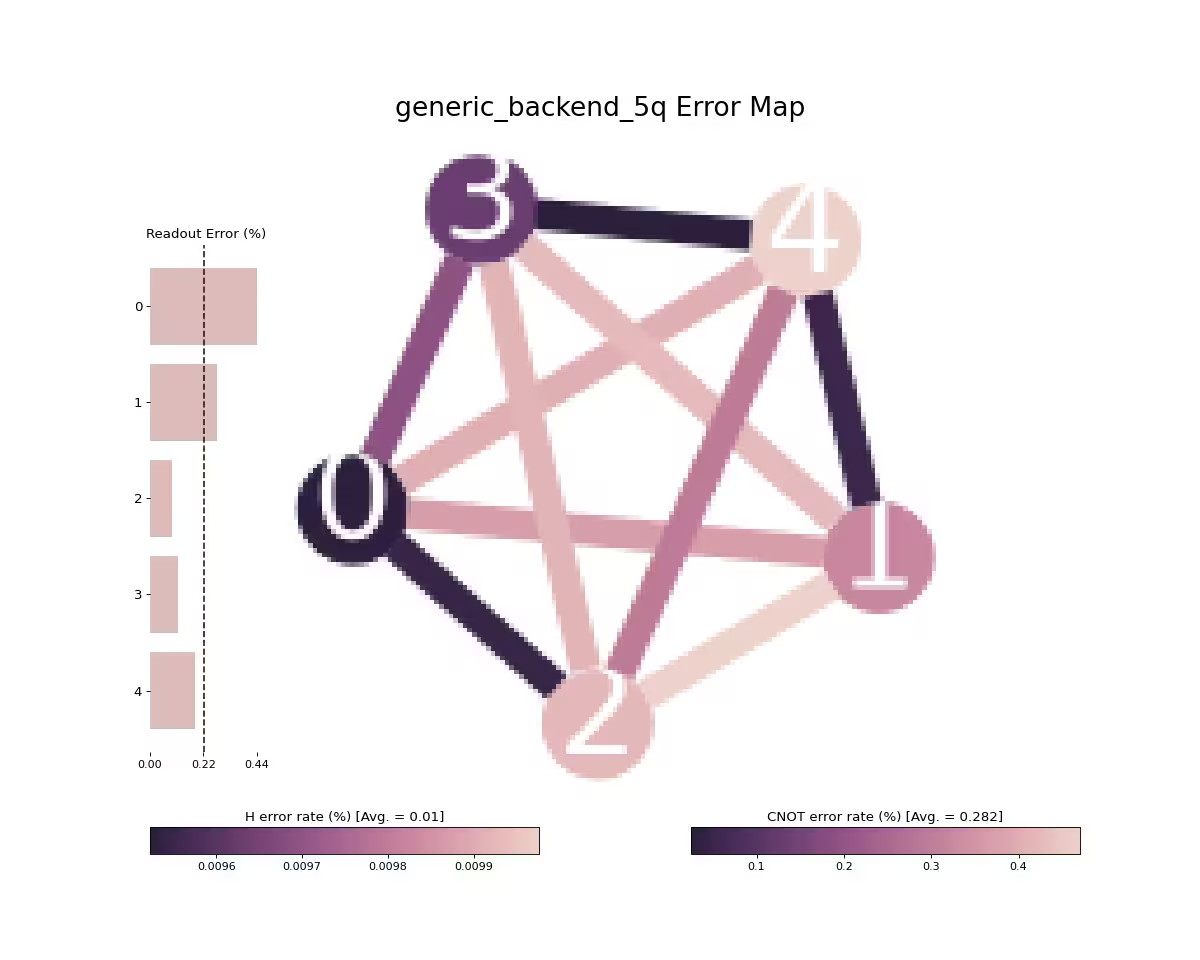
War diese Seite hilfreich?
Melden Sie auf GitHub einen Fehler, einen Tippfehler oder fordern Sie Inhalte an.